Visualizations help people to understand complex interrelations. In two of my formerly blog posts ImagePlot: Plotting Ahtila und Plotting Ahtila (… the story continues) I showed – using ImagePlot – that the finnish artist Eija-Liisa Ahtila who produced different versions of her film THE HOUSE (2002) to explore the differences between single-screen film and multi-channel installation put most of the single-screen-material to the middle screen of the 3-channel-version. Now I would like to show another way achieving that result.
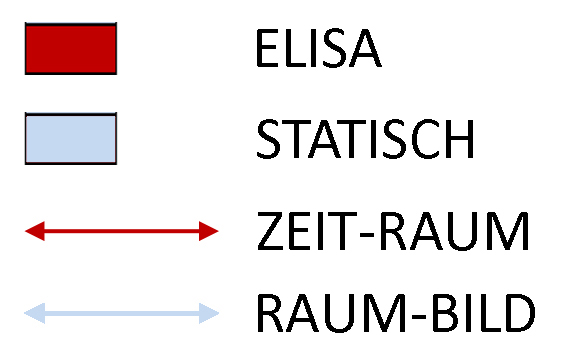
In a first step I built cutting patterns of both versions. In a second step I highlighted all shots showing Elisa, the female protagonist of THE HOUSE, and all shots which are static (that means there isn’t any activity): the first ones red, the second ones blue; white coloured shots don’t show neither Elisa nor are they static. As a result you see the following at a glance: In the 1-channel-version are a lot of shots that show Elisa and only some shots which are static, in the 3-channel-version are a lot of static shots on the left and right screen; shots that show Elisa exist mostly in the middle screen – an important outcome for understanding the steering of the beholder’s view!
The red and blue arrows I placed in my visualization of the 3-channel-version stand for specific interrelations between shots of the left, middle and right screen which I call Zeit-Räume and Raum-Bilder. But more about that you’ll read in my PhD thesis.


